EUR/USD Price Analysis: Moves below 1.0850 despite a bullish bias
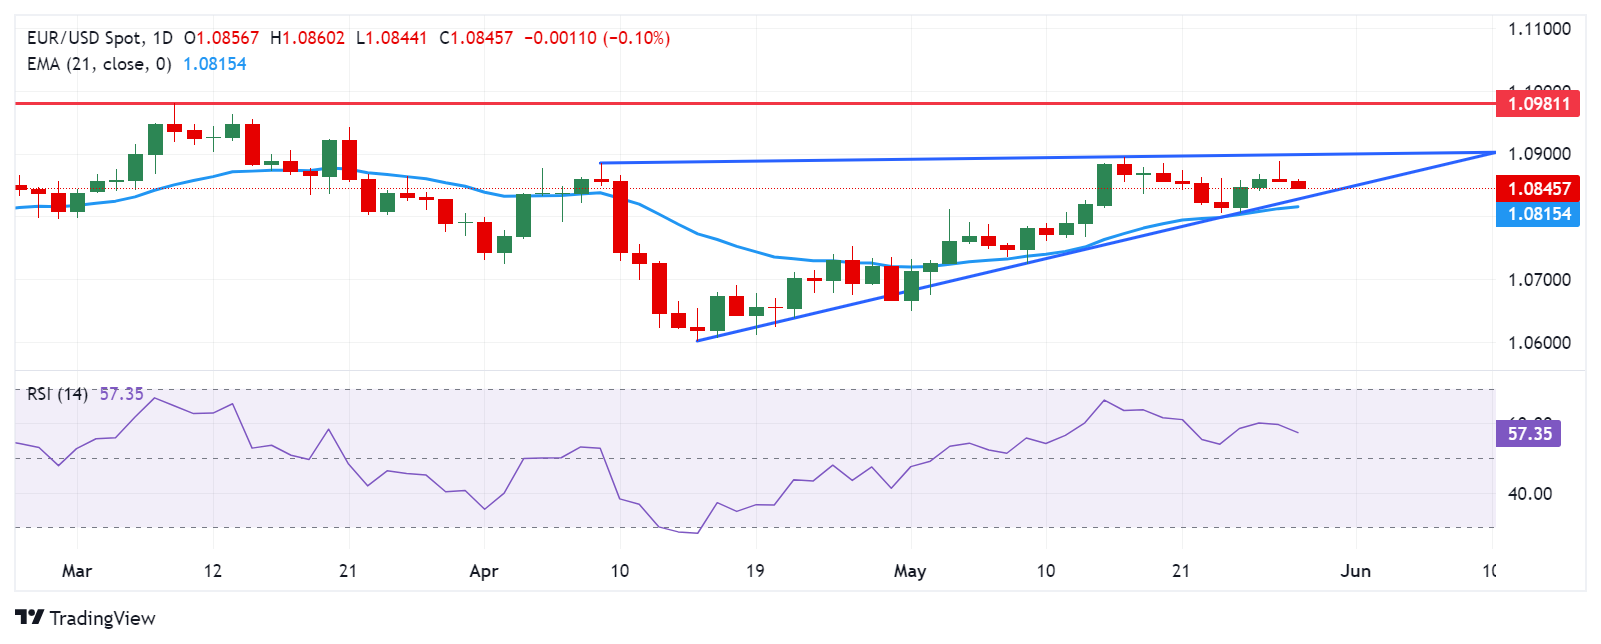
- EUR/USD consolidates within the ascending triangle, indicating a bullish bias.
- The upper boundary of the ascending triangle and the psychological level of 1.0900 appear to be key resistance levels.
- The pair could test the lower boundary of the ascending triangle, followed by the 21-day EMA at 1.0815.
EUR/USD extended losses to near 1.0850 during the Asian session on Wednesday. The pair faces challenges as the US Dollar (USD) gains ground amidst emerging risk aversion sentiment, possibly triggered by hawkish remarks from Minneapolis Fed President Neel Kashkari. Kashkari's comments suggest that rate increases are still a possibility and express uncertainty about the disinflationary process, with a prediction of only two rate cuts.
However, an analysis of the daily chart indicates a bullish bias for the EUR/USD pair, as it consolidates within an ascending triangle. Additionally, the 14-day Relative Strength Index (RSI) momentum indicator is slightly above the 50 level, further supporting this bullish bias.
The EUR/USD pair could potentially challenge the upper boundary of the ascending triangle, followed by the psychological resistance level at 1.0900. Breaking above this level could lead the pair toward the region around the significant level of 1.0950, followed by a three-month high of 1.0981.
On the downside, immediate support for the EUR/USD pair could be found at the lower boundary of the ascending triangle, followed by the 21-day Exponential Moving Average (EMA) at 1.0815. A breach below the psychological level of 1.0800 might exert downward pressure, potentially navigating toward the area around the significant level of 1.0700.
EUR/USD: Daily Chart

