Back
8 Jan 2020
Gold Price Analysis: XAU/USD erases daily gains, trades sub-$1600/oz
- The 2019 bull trend is rolling into 2020 with a bullish breakout.
- The level to beat for buyers is the 1560/1600 price zone.
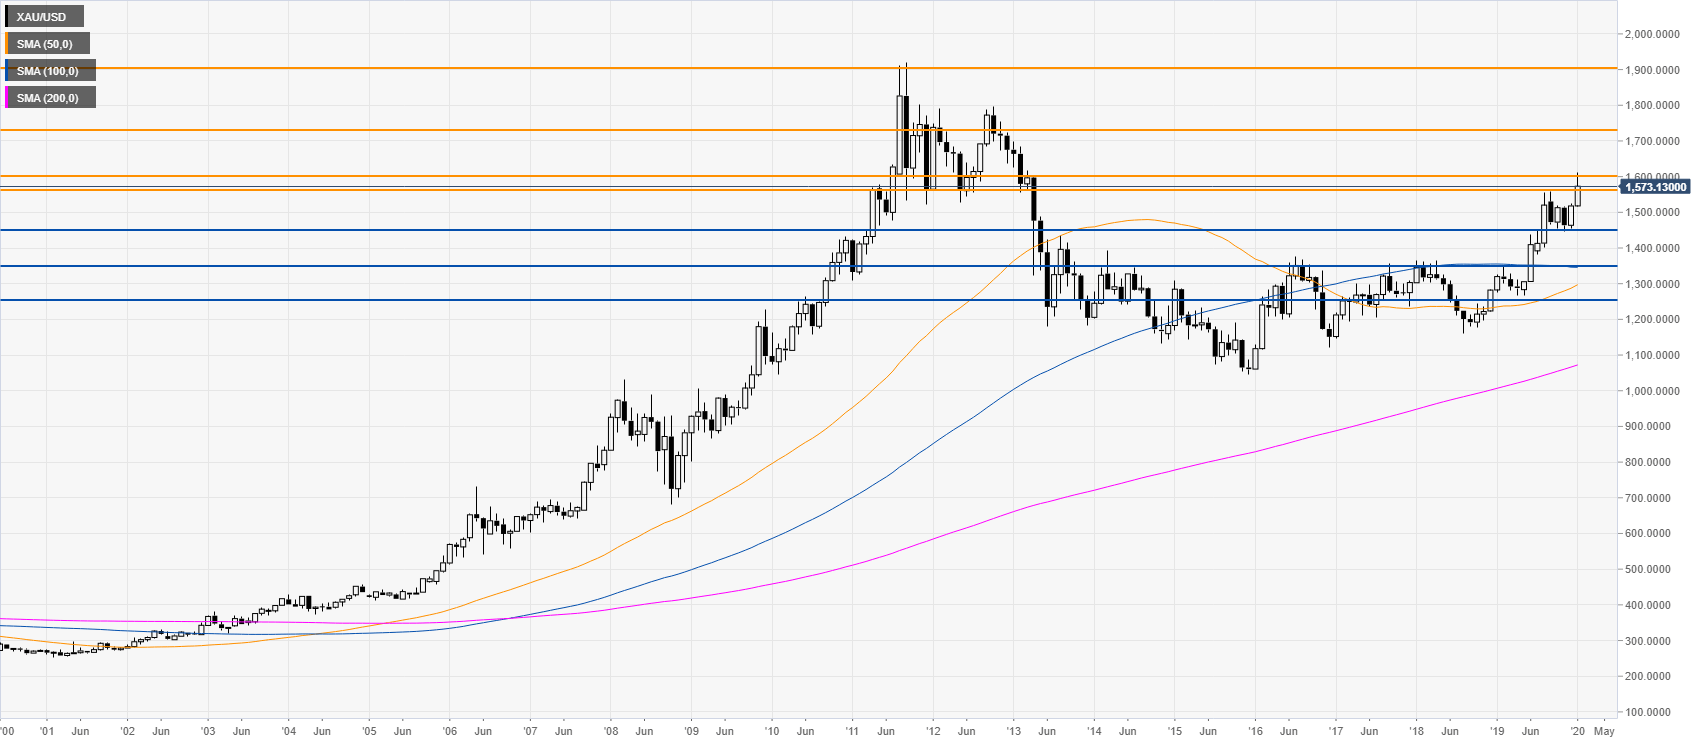
Gold monthly chart
Gold is trading in an uptrend above the main monthly simple moving averages (SMAs). The metal is trying to have a successful breakout above the 1560/1600 price zone. If the bulls overcome this key resistance zone on a daily basis, the market might run towards the 1730 and 1900 resistance levels.
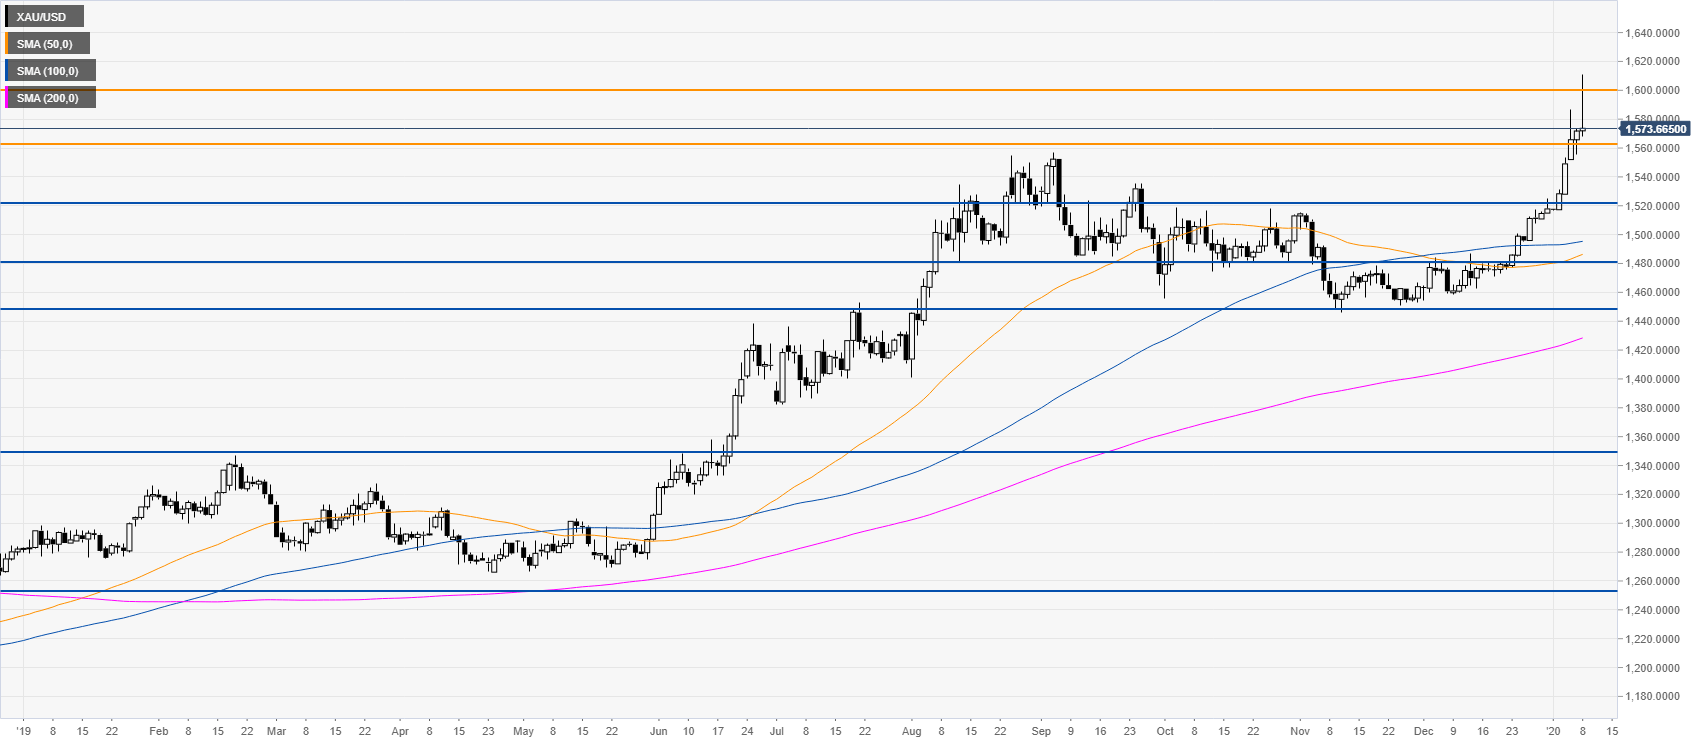
Gold daily chart
The market is currently rejecting the 1600 mark as the bears are erasing the daily gains. A daily close below the 1560 support could signal the start of a correction down. Support is seen at the 1520 and 1480 levels.
Additional key levels