Gold Price Analysis: Short-term support trendline, at $1,550, in focus
- Gold fails to extend the early-day recovery.
- Overbought RSI conditions, bullish exhaustion favor further declines.
- 21-day SMA adds to the support whereas buyers will wait for the sustained break of 23.6% Fibonacci retracement.
Gold prices turn mildly weak while flashing $1,558.80 as a quote during the early Thursday. The yellow metal’s failure to register much upside, despite being above near-term key supports amid overbought RSI conditions, increases the odds for the pullback.
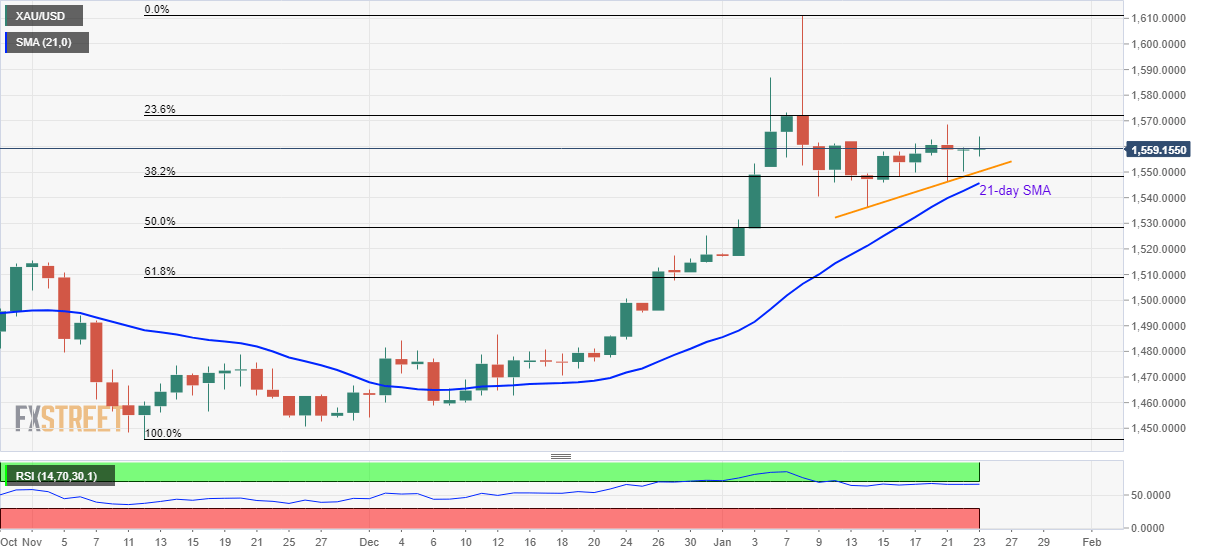
With this, an upward sloping trend line since January 14, at $1,550 now, followed by a 21-day SMA level near $1,545 gain sellers’ attention.
If at all prices remain weak below $1,545, 50% Fibonacci retracement level of the metal’s rise from November 2019 to January 08, 2020, at $1,528, will lure the bears.
On the upside, the bullion needs to close beyond 23.6% Fibonacci retracement level of $1,572, on a daily basis, to revisit January 06 high near $1,587 and $1,600 round-figure.
During the quote’s sustained run-up beyond $1,600, the monthly top surrounding $1,611 holds the gate for further rise to March 2013 high near $1,620.
Gold daily chart
Trend: Pullback expected