EUR/USD Price Analysis: 10-day SMA offers immediate support
- EUR/USD extends its pullback from 21-day SMA.
- 23.6% Fibonacci retracement can question sellers below 10-day SMA.
- 38.2% Fibonacci retracement adds strength to 1.1083/85 resistance confluence.
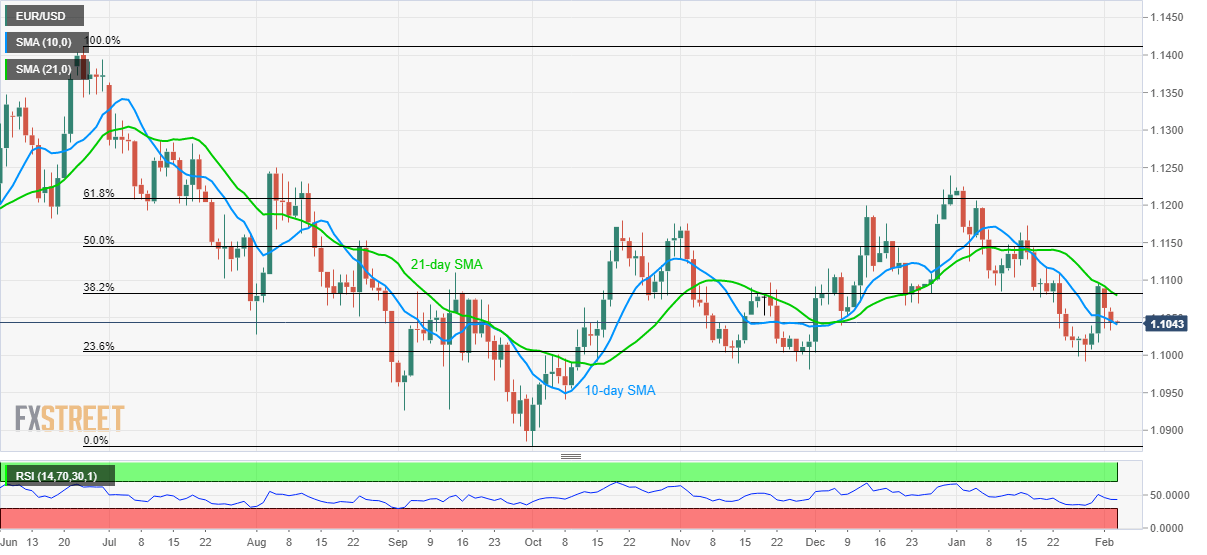
EUR/USD remains on the back foot near 1.1044 during the Asian session on Wednesday. The pair recently took a U-turn from 21-day SMA but stays above 10-day SMA.
While considering the pair’s gradual downside since the start of the year, prices are likely to continue being weak. However, 23.6% Fibonacci retracement of its June-October 2019 fall can challenge the bears around 1.1005 if the quote drops below a 10-day SMA level of 1.1040.
If at all the bears dominate past-1.1005, multiple lows marked since mid-October 2019 around 1.0990/95 will become the key to watch.
Alternatively, a confluence of 21-day SMA and 38.2% Fibonacci retracement near 1.1083/85 can keep the pair’s short-term upside limited.
While a sustained break of 1.1085 can recall 1.1120 on the charts, January 16 high of 1.1173 and 61.8% Fibonacci retracement level of 1.1208 will be of importance to the bulls during the further upside.
EUR/USD daily chart
Trend: Bearish